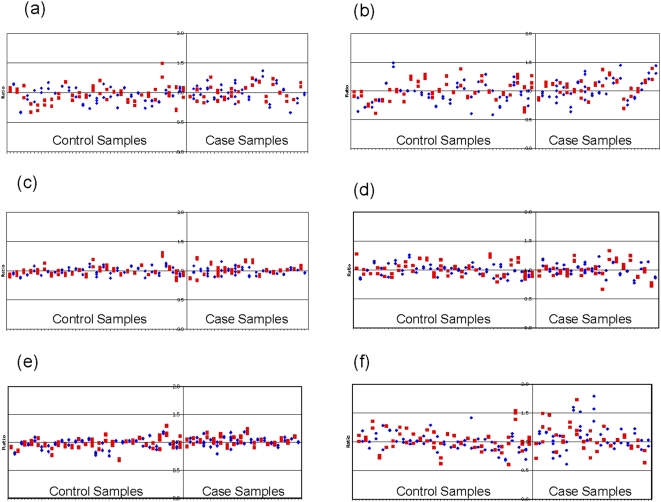
Figure 2. (a-f): Normalised ratios for both case and control samples across the six test probes.
Each plot includes at least two replicates per sample represented by the same symbol, with the symbols alternating between each sample. Samples were normalised using two control probes (see Table 1). Normal range 0.5–1.5.

