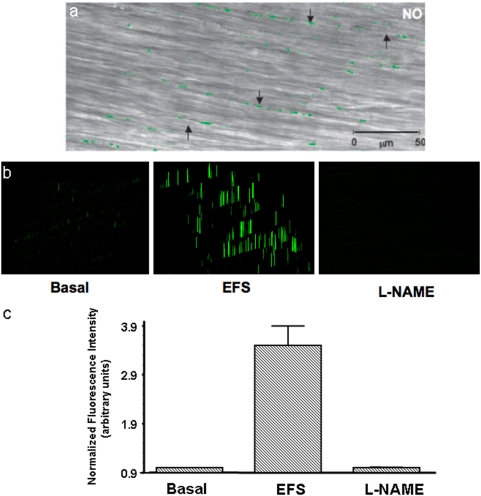
Figure 2. Visualization of NO signals in the varicosities.
These studies were done after EFS of the muscle strips preloaded with NO indicator DAF-2. (a) is a low power view showing the superimposed NO fluorescent image and the image in the transmission mode. Note the green fluorescent varicosities seen along axons running in the long axis of smooth muscles. Also note that there were no NO signals in the smooth muscles. (b) Represents examples of intensity profiles of the NO signals in the unstimulated varicosities, the varicosities in the muscle strip stimulated with EFS and a muscle strip that was treated with L-NAME prior to the stimulus. (c) Represents relative quantification of the NO signals. Note very small NO signals in the unstimulated state and in stimulated state after L-NAME treatment.

