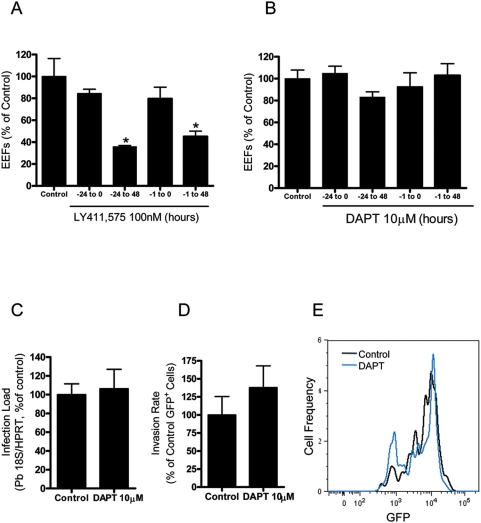
Figure 3. Plasmodium growth inhibition is not due to an interference with the cellular Notch signaling pathway.
(A) Effect of the incubation of Huh7 cells with 100 nM LY411,575 for different periods relative to sporozoite addition. Infection was measured by immunofluorescence microscopy 48 h after addition of 20000 P. berghei ANKA sporozoites. Control cells were treated with an equivalent amount of DMSO. Experiments were conducted in triplicates. Results are plotted as percentages of the mean value of the control samples. *: p<0.05. (B, C) Effect of 10 µM DAPT on infection of Huh7 cells, measured by immunofluorescence microscopy (B) or qRT-PCR (C) 30 h after addition of 20000 P. berghei ANKA sporozoites. Control cells were treated with an equivalent amount of DMSO. Experiments were conducted in triplicates. Results are plotted as percentages of the mean value of the control samples. (D) Effect of the incubation of Huh7 cells with 10 µM DAPT on the percentage of GFP-positive cells collected 2 h after addition of 20000 GFP-expressing P. berghei ANKA sporozoites and analysed by FACS. Control cells were treated with an amount of DMSO equivalent to that of the highest drug concentration. Experiments were conducted in triplicates. Results are plotted as percentages of the mean value of the control samples. (E) Representative lines of GFP intensity of Huh7 cells treated with 10 µM DAPT and solvent-treated control cells 30 h after addition of 20000 GFP-expressing P. berghei ANKA sporozoites and analysed by FACS.

