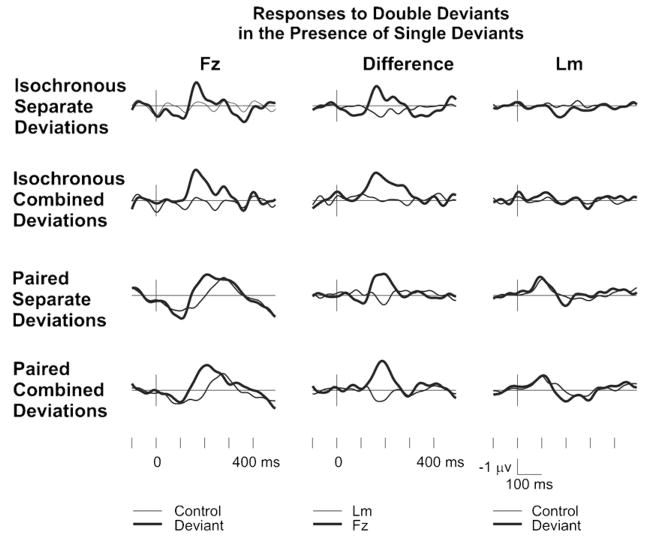
Fig. 2.
ERP responses. Group-averaged (N = 10) frontal (Fz; left column) and left mastoid (Lm; right column) ERP responses elicited by double deviants (thick line) and corresponding control stimuli. The corresponding difference waveforms are plotted in the central column. 0 ms is at the onset of the first tone of the double deviant.

