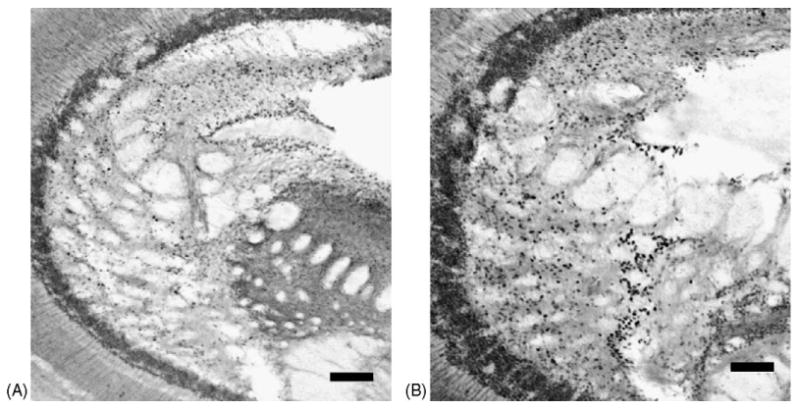
Fig. 2.

Representative posterior optic tecta from control (sham control, A), and stressed (DA-exposed, B) killifish brains (100× magnification). Note the increase in c-Fos expression represented by black punctuate nuclei in the stressed brain (B). The STX exposure displayed a decrease in c-Fos expression when compared to controls. Scale bar = 100 μm.
