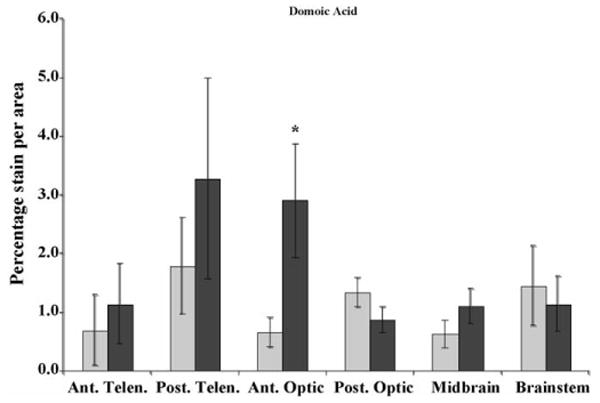
Fig. 4.

c-Fos expression in sham control (light gray) and domoic acid exposed (dark gray) killifish brains (N = 4, data are means ± S.E.). Ant. Telen., anterior telencephalon; Post. Telen., posterior telencephalon; Ant. Optic, anterior optic lobe; Post. Optic, posterior optic lobe; Midbrain, midbrain tegmentum; and Brainstem, rhombencephalon. The y-axis is the percentage of c-Fos expression per area (mm2). Significant increases in c-Fos expression occurred in the Ant. Optic region (*p = 0.05).
