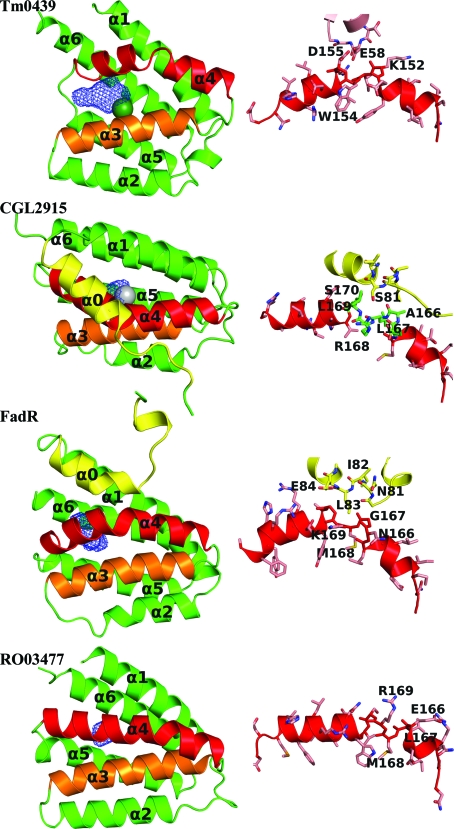
Figure 3.
The regulatory domain of TM0439 and comparison with other FCD/FadR domains. The overall domain structure and a close-up of the kinked helix α4 is shown for each protein on the right and left, respectively. In each domain the kinked α4 helix is shown in red. The seventh helices of the FadR-group members, α0, are shown in yellow. The wire cages are the cavities calculated by VOIDOO (Kleywegt & Jones, 1994 ▶). The metals are displayed with a radius of 2.0 Å to highlight their position.

