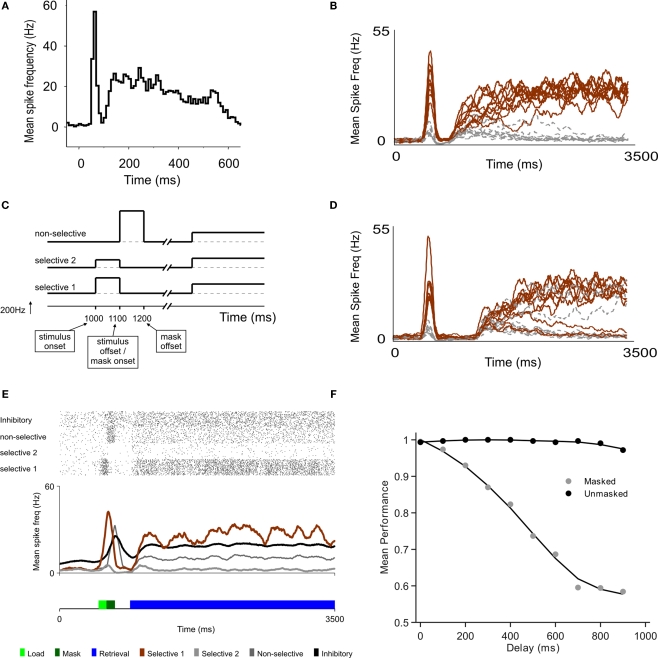
Figure 1.
A model of sensory decay and top-down memory retrieval. (A) Neural recording in area V1 from a monkey performing a contour grouping task (Li et al., 2006), showing a first initial transient followed by a second wave of delayed activations. (B) Two-stage responses in a recurrent model of cortical processing. Top-down control, which sets the circuit in a winner-take-all mode, is directed to the network 300 ms after stimulus offset. The average firing rate of selective (brown) and non-selective (grey) populations are plotted (firing rates are averaged in causal windows of 100 ms and sliding steps of 5 ms). (C) Schematic time course of input signals. The model is submitted to a series of two stages, defined by the particular configuration of external currents (top-down, bottom-up). In the first stage, which corresponds to the bottom-up stimulation generated by stimulus presentation, external inputs are increased for both populations of selective neurons, in 240 Hz for the population with higher selectivity and in 120 Hz for the population with lower selectivity. This stimulation lasts 100 ms and is followed by a mask, which is modeled as a stimulation of non-selective cells also during 100 ms. In the second stage, after a delay which is under experimental control, top-down control is directed to the network, modeled as a constant input to all excitatory cells. (D) Predicted neural activations of an electrophysiological experiment that has not been done, bracketing stimulus presentation and top-down control. The duration of the buffer is 700 ms. (E) The excitatory neurons are divided in those selective to target 1, to target 2, and non-selective. Visual masking (dark green box) is represented as a stimulation of excitatory non-selective cells that through shared inhibitory connections increase the decay rate of the stimulus trace. A raster plot of representative (randomly selected) neurons of all populations is shown, as well as the average activity of each group. (F) Proportion of correct retrievals as a function of the duration of the perceptual buffer, for trials with and without backwards mask.

