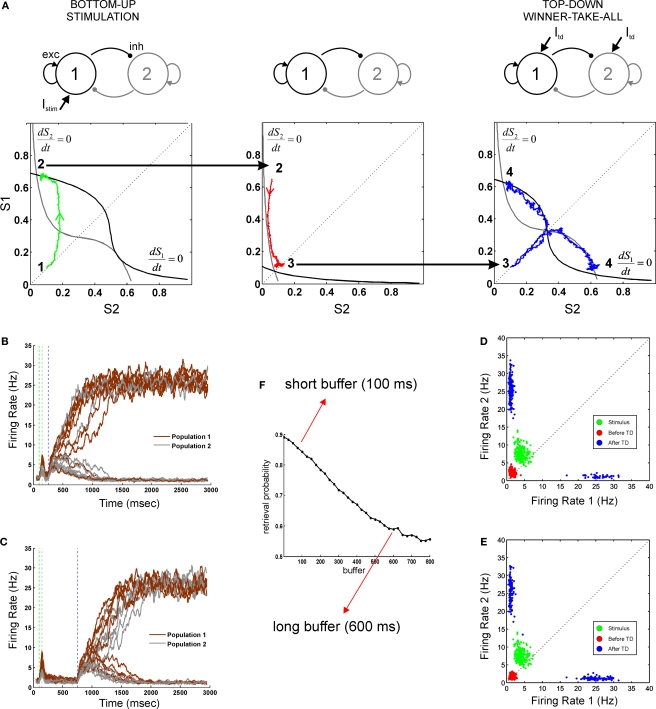
Figure 2.
Neural dynamics as a concatenation of discrete processing stages. (A) Sketch of the mean-field architecture and trajectories in phase space. Output synaptic gating variables are plotted against each other. Nullclines for S1 and S2 are plotted in black and grey, respectively. When the stimulus is presented, the system evolves towards the high S1/low S2 asymmetrical attractor. During the buffer, the fixed point in the quiescent state becomes stable and the system evolves towards this fixed point. Top-down control reconfigures the phase space, forcing the system to one of the two high-level attractors. Two trajectories are plotted from the same initial point, giving one correct and one incorrect response. (B,C) Time course of firing rates for short (B) and long (C) buffers. Firing rates are constructed averaging activity over windows of 25 ms, with sliding steps of 5 ms. Red, green, and blue dotted lines indicate load onset, load offset, and retrieval onset, respectively. (D,E) Each processing stage can be understood as a stochastic map in phase space as seen by the distributions of the final states (200 trials) of each processing stage (load, before top-down and after top-down, in green, red and blue, respectively). Each data point indicates the average activity (firing rate) of the last 12.5 ms of the corresponding phase, for short (D) and long (E) buffers. (F) Percent of correct retrievals as a function of the duration of the buffer. Each point is the average over 10,000 trials.

