Figure 3.
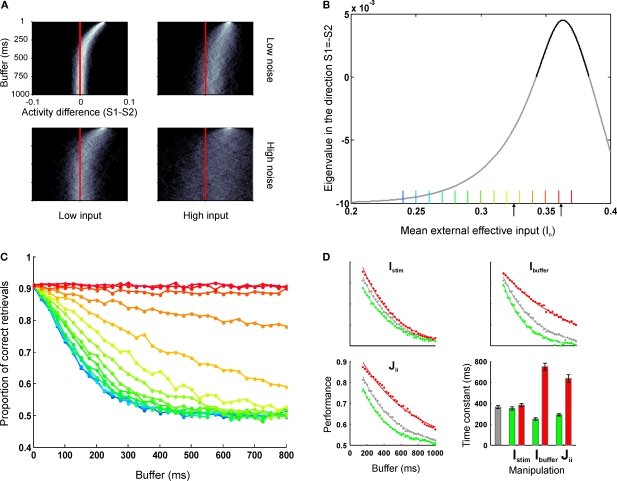
The dynamics of error and correct responses during memory decay and retrieval. (A) We explored the progression of the distance to the decision boundary during the buffer. The four panels represent a factorial exploration of the effects of background current during the buffer [low (left column) and high (right column) input currents] and the noise level [low (top panels) and high noise (bottom panels)]. Within each panel, each line represents a histogram, coded in a grey color code. The y-axis indicates buffer time and the x-axis indicates the difference in activity between S1 and S2. In all panels it can be seen that in the beginning of the buffer activity is clustered in a value of (S1 − S2) (the initial condition had no dispersion) and as time passes (going down in the y-axis) the distribution probability approaches the decision boundary and becomes wider. (B) The speed of convergence to the decision boundary can be estimated by calculating the eigenvalue of the quiescent fix point in the linearized system as a function of the background input currents. For high background currents – just bellow the bifurcation – speeds are arbitrarily slow (stimulus memory is lost by noise diffusion). For lower currents, the speed increases (in absolute value) reaching an asymptote which establishes a maximal rate of convergence and thus a minimal temporal decay constant. This critical time is determined by the NMDA temporal constant and determines that perceptual buffers last at least about 100 ms. The current values which correspond to the retrieval mode (positive eigenvalue) are indicated in bold. Black arrows indicate the default values used as background currents during buffer (I0 = 0.3255 nA) and retrieval (I0 = 0.3619 nA) throughout the paper. (C) Simulations of a sensory retrieval experiment using the original (non-linear) system of equations, varying the duration of the buffer and the background current during the buffer. Information is lost exponentially with a time constant which increases with increasing currents and has a lower bound. Each curve is the average over 5,000 trials. Each color represents a different input value, as indicated in Figure 2B. Values range from 0.24 to 0.37 nA, in intervals of 0.01 nA. (D) Effect of different parameter manipulations on task performance: stimulus intensity (Istim, upper left panel), top-down currents during the buffer (Ibuffer, upper-right panel), and recurrent strength (Jii, lower left panel). The baseline (same as data in Figure 2F) is plotted in gray. Higher values are plotted in red and lower values in green. Data is fitted with exponential distributions. Error bars indicate 95% confidence bounds.

