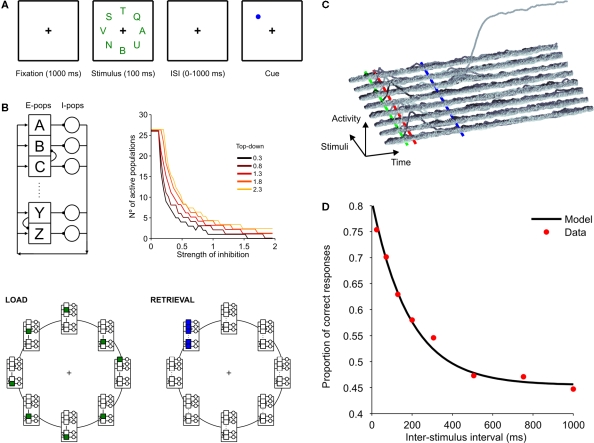
Figure 5.
Simulation of a partial report experiment. (A) Sketch of the partial report experiment (Graziano and Sigman, 2008). Eight letters appeared simultaneously for 106 ms on a computer screen, arranged on a circle (5.5°) around the fixation point. Each letter was presented in uppercases and chosen at random from a set of 26 letters. Trials started with a fixation point at the center of the display. After 1,000 ms, the array of eight letters was shown for 106 ms. After removal of the array of letters participants were cued with a color marker at the location of the letter that had to be reported. The cue was maintained on the screen until participants made a forced choice. Eight target-cue asynchronies (ISI) were investigated: the cue appeared 24, 71, 129, 200, 306, 506, 753, 1,000 ms after the offset of the array display. (B) Description of the network and of the model. Each letter is represented by a variable with a normalized output in the range (0, 1). For simplicity, we neglect any interaction between letters in different positions of the stimulus array and thus the eight different locations are modeled independently. The network is endowed with local excitatory connection – each excitatory population connects to one inhibitory population – and global inhibition – each inhibitory population projects uniformly to all excitatory populations. The number of active populations in the stable state decreases with the inverse of inhibition strength and increases with top-down strength. This dependency assures that a wide range of parameters exists for which the network is set in a winner-take-all mode (i.e. retrieves a single population). In each location, only one population receives bottom-up input during stimulus presentation (green populations in the lower-left panel). During retrieval, all excitatory populations receive equal top-down currents (blue populations in the lower-right panel). (C) Transient responses to the stimuli and top-down amplification at the target location. In each position, the activity of the 26 possible responses (letters) is plotted. Top-down current sets a winner-take-all competition at target location, where the initial transient response biases the competition towards the presented letter. Stimulus onset, stimulus offset, and cue onset are marked with green, red and blue lines respectively. (D) Performance for human subjects (red dots) and model (black line). Solid curve was obtained by fitting model simulations to an exponential distribution (R2 > 0.995). Data for the fit was obtained by averaging 3,000 simulations at each of 43 inter-stimulus-cue intervals (from 0 to 1,050 ms at intervals of 25 ms).

