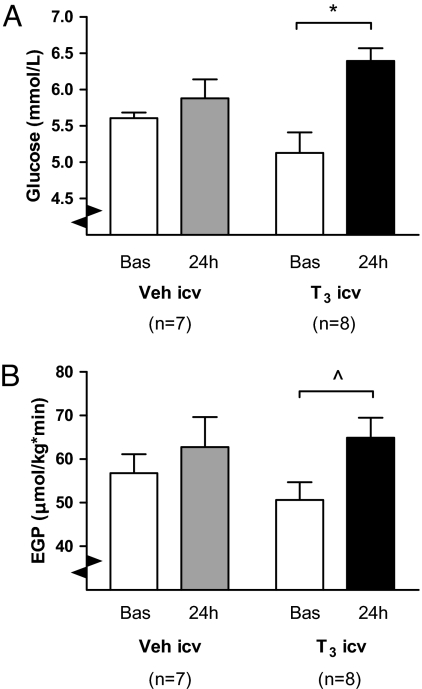
Fig. 1.
(A) Mean plasma glucose concentration in i.c.v. Veh- and T3-treated animals, before (basal) and after (24 h) bolus i.c.v. infusion. Note the marked, 22% plasma glucose increase in i.c.v. T3-treated rats, whereas in Veh-treated rats there was no significant effect on plasma glucose. ANOVA indicated P = 0.003 for factor time and P = 0.032 for factor time*group. *, P < 0.01. (B) EGP before (Bas) and after (24 h) i.c.v. T3 or Veh bolus infusion. EGP tended to increase after i.c.v. T3- treated rats (*, P = 0.057), but not in i.c.v. Veh-treated animals (P = 0.482). ANOVA indicated P = 0.062 for factor time.

