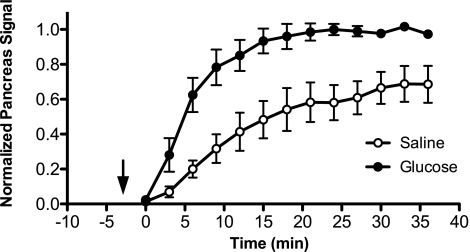
Fig. 2.
Normalized time-signal intensity curves (TICs) for the pancreas after saline and glucose infusions in normal mice. Mn2+-enhanced MR signal in the pancreas (normalized to liver signal) after saline and glucose infusions is plotted vs. time after MnCl2 injection. Arrow denotes time of injection for saline/glucose, and MnCl2 was injected at time = 0 min. Data were fit to a sigmoid function, and 2-way ANOVA was performed on the parameters corresponding to sigmoid function plateau height and slope (see research design and methods). Data points represent means ± SE from 5 mice.

