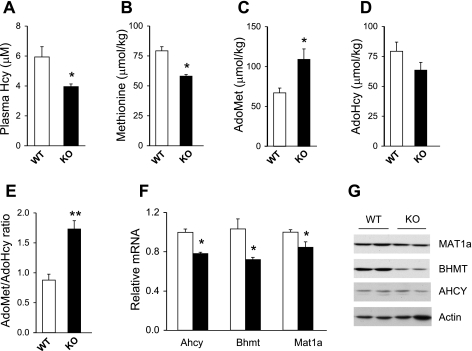
Fig. 4.
Effects of PGC-1α deficiency on plasma tHcy levels and the methionine cycle. A: concentrations of plasma tHcy in wild-type (WT; open bars) and PGC-1α null (KO; filled bars) mice. B–E: concentrations of methionine (B), AdoMet (C), AdoHcy (D), and the AdoMet-to-AdoHcy ratio (E) in-wild type and PGC-1α null mouse livers. Data in A–E represent means ± SE. *P < 0.03 and **P < 0.001, wild type vs. null. F: qPCR analysis of gene expression in pooled RNA from wild-type (open bars) and PGC-1α null (filled bars) mouse livers. Data in F represent means ± SD. *P < 0.03, wild type vs. null. G: immunoblots of total liver lysates from wild-type and PGC-1α null mice.

