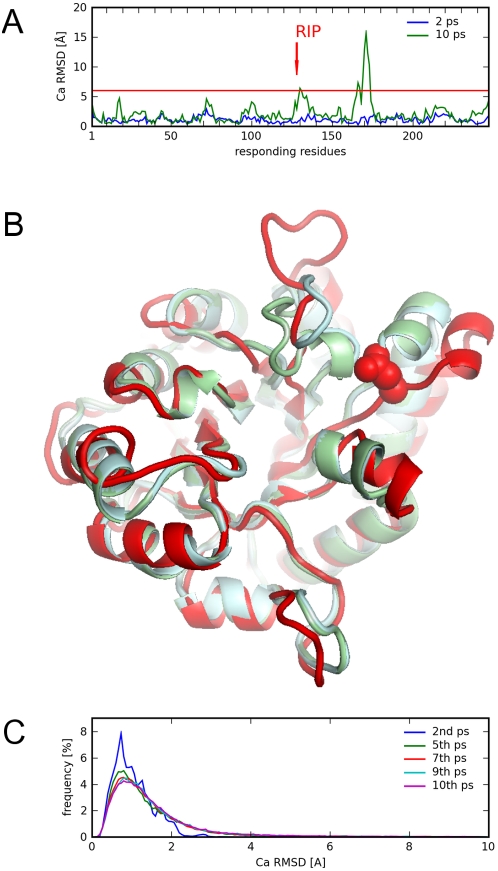
Figure 3. RIP-induced conformation changes of TIM.
(A) the Cα RMSD response to the perturbation of RIP on Glu128 (red arrow) shown after 2 ps (blue) and at the end of the 10 ps simulation (green). (B) The 10th ps conformation (red) of the TIM structure due to RIP on Glu128 (red spheres), overlaid over the closed state (blue) and open state (green) of the crystal structures. (C) The frequency distribution of Cα RMSD for all residues from the entire set of perturbations of RIP over every residue in TIM.

