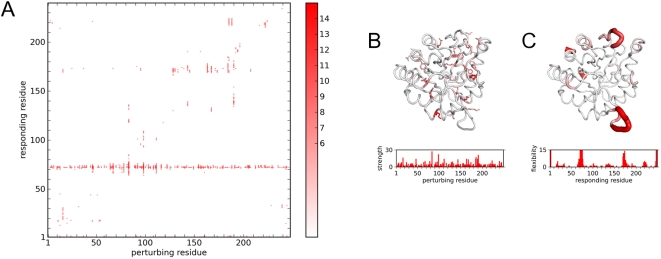
Figure 4. The global Cα RMSD response of TIM to RIP.
(A) Each column corresponds to the perturbation of the residue marked by the X-value. Intensity represents Cα RMSD deviation for the 10th ps of simulation above background (>6.0 Å). (B) Perturbation strength histogram and structural linchpins. Structural linchpins are defined if the number of residues with Cα RMSD >6Å induced by a residue is greater than 3σ above the mean. The structural linchpins are mapped onto the structure as sticks. Scale is 0 (white) to 30+ (red). (C) Conversely, local regions that are highly susceptible to perturbation can be identified via a local flexibility histogram and mapped onto the structure. Scale is 0 (white) to 15+ (red).

