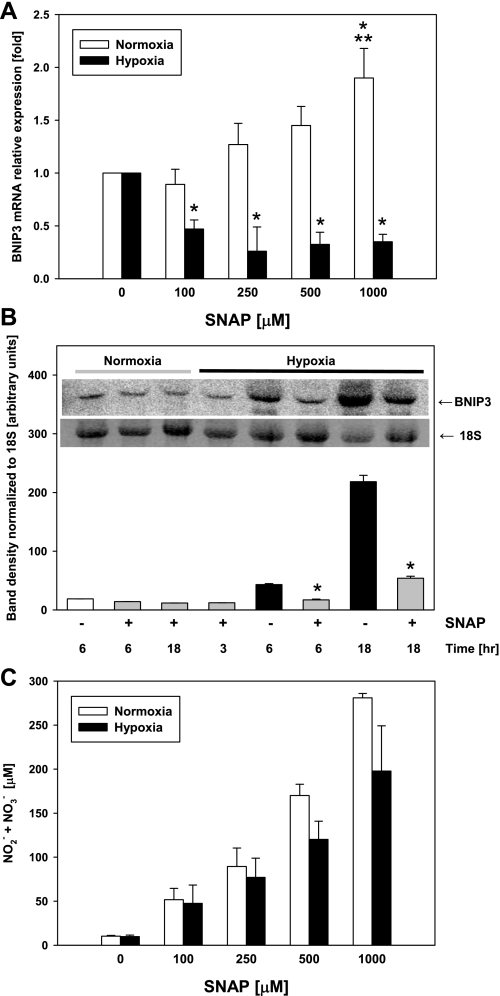
Fig. 2.
Effect of hypoxia on BNIP3 expression in the presence of NO in hepatocytes. Freshly isolated rat and mouse hepatocytes were exposed to hypoxia (1% O2) in the presence or absence of SNAP (100–1,000 μM), and the mRNA was isolated and analyzed as described in materials and methods. Control samples were hepatocytes cultured under normoxic conditions. A: Northern blot analysis for BNIP3 mRNA in rat hepatocytes. Data were normalized using 18S band density as loading control and represent fold change vs. respective nontreated controls. Results are means ± SE (n = 4). *P < 0.01 vs. 0 SNAP. **P < 0.01 vs. 100 μM SNAP. Data were analyzed by 1-way ANOVA followed by the Tukey's test. B: Northern blot analysis (inset) and densitometric quantification for BNIP3 mRNA in mouse hepatocytes cultured under normoxic or hypoxic conditions in the presence or absence of SNAP (100 μM) as indicated. Results are means ± SE (n = 3). *P < 0.001 vs. normoxia. Data were analyzed by Student's t-test. C: levels of nitrite/nitrate (NO2−/NO3−) in supernatants of rat hepatocytes cultured in the presence or absence of SNAP under normoxic or hypoxic conditions as indicated. Results are means ± SE of 4 independent experiments.

