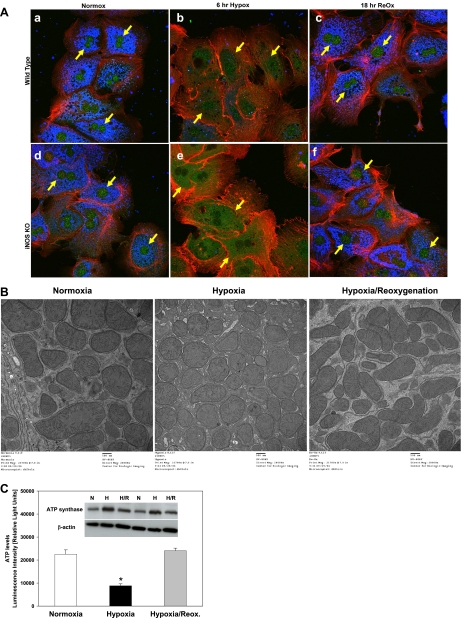
Fig. 3.
Effect of hypoxia and H/R on BNIP3 subcellular localization in wild-type and inducible NO synthase (iNOS)-null mouse hepatocytes. A: freshly isolated hepatocytes (wild type, a–c; iNOS null, d–f) were cultured under normoxic (control; a and d) or hypoxic conditions (1% O2; b and e) for 6 h. Parallel hypoxic cultures were returned to the normoxic incubator for 18 h of reoxygenation (c and f). Cells were then fixed and processed for confocal immunofluorescence imaging as described in materials and methods. Fluorescent labeling: BNIP3, green; ATP synthase, blue; F-actin, red. B: in parallel experiments, cells were fixed and processed for transmission electron microscopy as described in materials and methods. Compared with normoxic control, no loss of mitochondria was observed after exposure to hypoxia (6 h) or H/R for 18 h. C: freshly isolated hepatocytes were cultured under normoxic (control) or hypoxic conditions (1% O2) for 6 h. Parallel hypoxic cultures were returned to the normoxic incubator for 18 h of reoxygenation. ATP levels were measured using the CellTiter-Glo luminescent cell viability assay kit as described in materials and methods. Results are means ± SE (n = 6). *P < 0.001 vs. normoxia and H/R. Data were analyzed by 1-way ANOVA followed by Tukey's test. Inset shows a Western blot for ATP synthase protein expression under the same experimental conditions as described above (n = 2).

