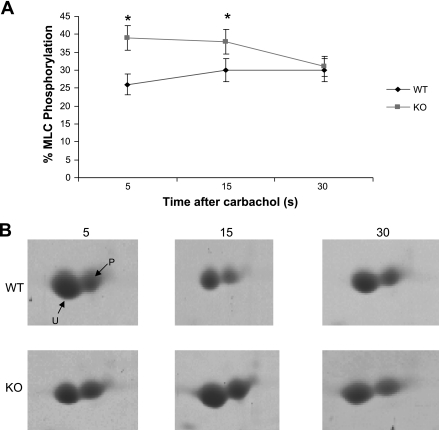
Fig. 5.
A: time course of MLC20 phosphorylation at 5, 15, and 30 s after activation with 20 μM carbachol. The mean level of phosphorylation at each time point was 26.4 ± 2.9, 30.0 ± 3.2, and 30.0 ± 3.5%, respectively, for WT bladders and 39 ± 5.1, 38 ± 4.4, and 31 ± 3.3% for SM-B KO bladders, P < 0.05, n = 4. B: representative 2-dimensional gels showing unphosphorylated and phosphorylated MLC20 at each time point for WT and SM-B KO bladders, respectively.

