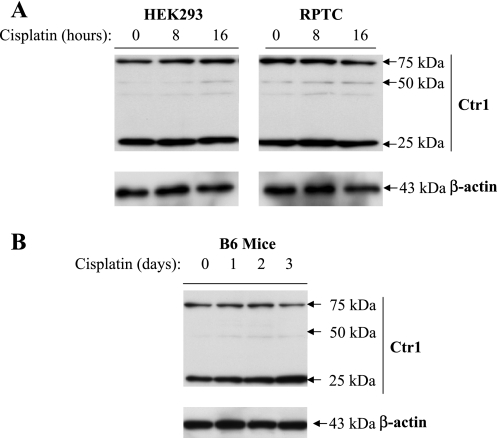
Fig. 2.
Ctr1 expression renal cells and tissues during cisplatin treatment. A: HEK293 and renal proximal tubule cells (RPTC) cells were treated with 20 and 40 μM cisplatin, respectively, for indicated time points, and whole-cell lysates were collected and used for immunoblot analysis of Ctr1. B: male C57BL/6 mice were treated with 30 mg/kg cisplatin, and kidney lysates were prepared on days 0, 1, 2, and 3 for immunoblot analysis of Ctr1.

