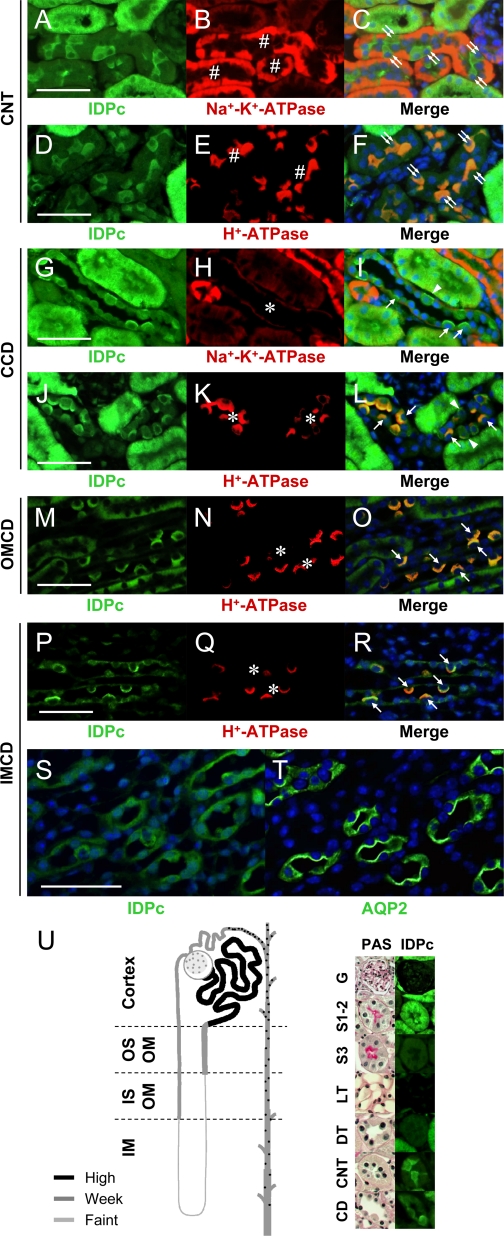
Fig. 3.
Expressions of IDPc in connecting tubule (CNT) and collecting duct (CD). A–L: kidney sections were double-stained with anti-IDPc and then with anti-Na+-K+-ATPase or anti-H+-ATPase antibodies. A–F: IDPc is highly expressed in the cytoplasm of intercalated cells in CNT but is weakly expressed in CNT cells. #, CNT; double arrows, intercalated cells of CNT. G–L: some intercalated cells of cortical CD (CCD) express IDPc in the apical domain (arrow), whereas some cells express IDPc in the basolateral domain (arrowhead). In principal cells, IDPc is weakly expressed in the cytoplasm. M–O: intercalated cells of outer medullar CD (OMCD) only express IDPc in the apical domain (arrow). P–R: intercalated cells of inner medullar CD (IMCD) also express IDPc in the apical domain (arrow). S and T: serial kidney sections mounted on the same slide were stained with anti-IDPc and anti-AQP2 antibodies. Principal cells in IMCD weakly express IDPc in cytoplasm. U: diagram of IDPc expression in the mouse kidney. Some kidney sections were stained with periodic acid Schiff (PAS) for morphological clarity. #, CNT; *, CD; G, glomerulus; S1–2, S1–2 segment proximal tubule; S3, S3 segment; LT, thin limb. Bars: 50 μm.

