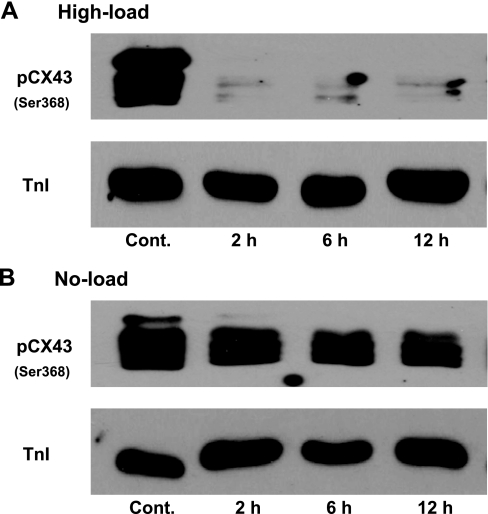
Fig. 3.
Comparison the phosphorylation level of Cx43 (pCx43) at Ser368 using immunoblot analysis of high-loading samples at 2, 6, and 12 h (A) vs. no-load samples at the same point (B). cTnI was used to indicate the amount of protein loading because no change in the ratio of Cx43 to cTnI was detected in 12 h of culture shown in Fig. 2. Each set of controls and cultured muscles were from the same hearts.

