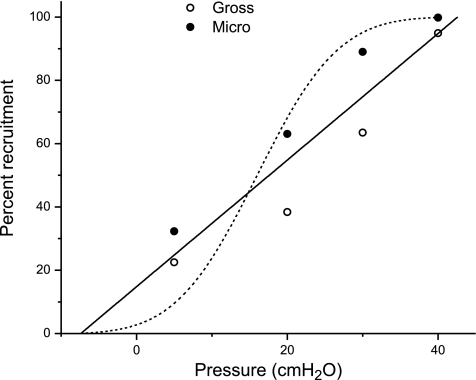
Fig. 3.
Total percent recruitment against starting pressures and recruiting pressures for gross (○) and microscopic (•) recruitment. Solid line represents the least squares regression for a straight line fitted to all data points. Broken line represents an integrated Gaussian function with mean of 16 cmH2O and a standard deviation of 12 cmH2O.

