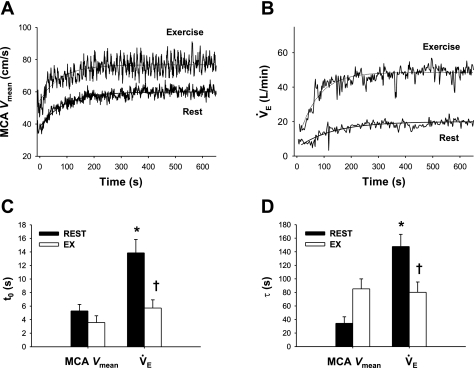
Fig. 3.
A and B: continuous recordings of middle cerebral artery (MCA) mean blood velocity (Vmean) and V̇e during hypercapnia at rest and during exercise in 1 representative subject. Hypercapnia was started at time 0. C and D: group-averaged t0 and τ of MCA Vmean and V̇e exponential fitting curves at rest and during exercise. Values are means ± SE. *P < 0.05 vs. MCA Vmean. †P < 0.05 vs. rest.

