Fig. 5.
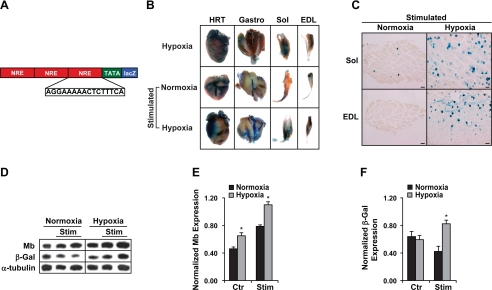
Electrical stimulation in combination with hypoxia was a potent inducer of NFAT activity and myoglobin expression in vivo. A: schematic illustrating the transgene construct for the NFAT indicator mice. NFAT response elements (NRE) are linked in tandem to a basal promoter to direct lacZ reporter activity. The hindlimb muscles of transgenic NFAT indicator mice were electrically stimulated for 30 h (supramaximal pulses of 0.2-ms duration at a frequency of 10 Hz) using miniature neuromuscular stimulators implanted subcutaneously and attached to the sciatic nerve. B: whole-mount staining for β-galactosidase enzymatic activity in the heart (HRT) and skeletal muscles [gastrocnemius/plantaris (Gastro) complex, soleus (Sol), and extensor digitorum longus (EDL)] reveals increased expression in striated muscles of mice exposed to hypoxic conditions compared with normoxic conditions. All mice received electrical stimulation. C: transverse sections through the EDL and soleus showing the increased expression of β-galactosidase in the hypoxic stimulated muscles as compared with normoxic stimulated controls. D: Western blot analysis of myoglobin, β-galactosidase (β-Gal), and α-tubulin (loading control) expression from electrically stimulated tibialis anterior muscles (TA) of NFAT indicator mice after 30 h of neuromuscular stimulation. Mice were exposed to normoxic or hypoxic (10% oxygen) conditions. The electrically stimulated TA (stimulated) and nonstimulated (control) TA muscles were analyzed for protein expression. The results reveal a significant increase in the protein concentration of both myoglobin and β-galactosidase in hypoxic stimulated TA as compared with normoxic stimulated muscle. These results differ from the significant reduction in myoglobin protein concentration seen in the TA from unstimulated animals exposed to chronic hypoxia for up to 21 days. E: quantitation of the Western blot analysis of myoglobin expression from the respective animals (stimulated vs. control under normoxic and hypoxic conditions) normalized to the expression of α-tubulin. F: quantitation of the Western blot analysis of β-galactosidase expression from the respective animals (stimulated vs. control under normoxic and hypoxic conditions) normalized to the expression of α-tubulin. *Statistically different from normoxic values (n = 3, P < 0.05).

