Fig. 1.
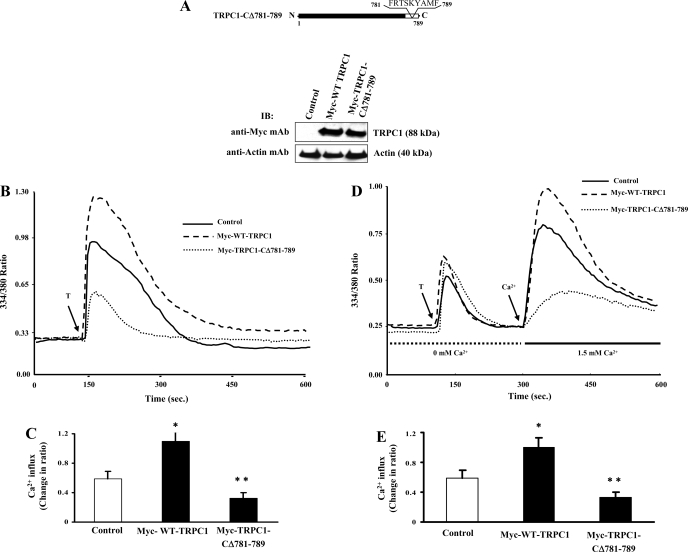
Expression of transient receptor potential canonical channel 1 (TRPC1) COOH-terminal 781-789-truncated mutant prevents Ca2+ store depletion-activated Ca2+ influx in endothelial cells. A: human dermal microvascular endothelial cell line (HMEC) cells were transfected with the Myc-wild-type (WT)-TRPC1 or Myc-TRPC1-CΔ781-789 constructs. At 48 h after transfection, cells were lysed and immunoblotted (IB) with anti-Myc-mAb to determine TRPC1 protein expression. The membrane was stripped and reprobed using anti-β-actin mAb (bottom). Schematic of the TRPC1 COOH-terminal residues 781-789 deletion mutant construct is shown. B: HMEC grown on glass coverslips were transfected with either Myc-WT-TRPC1 or Myc-TRPC1-CΔ781-789 expression constructs (see details in materials and methods). At 48 h after transfection, cells were loaded with Fura-2 AM and placed in Ca2+ and Mg2+ containing HBSS and stimulated with thrombin (50 nM) to measure increase in intracellular Ca2+. Arrow indicates time at which cells were stimulated with thrombin (T). Experiments were repeated at least 4 times. A representative profile is shown. C: peak change in fluorescence ratio (334/380) in control and Myc-WT-TRPC1 or Myc-WT-TRPC1 and Myc-TRPC1-CΔ781-789-expressing cells was compared. *P < 0.05 significantly different from control; **P < 0.001 significantly different from Myc-WT-TRPC1. D: thrombin-induced Ca2+ store depletion-mediated Ca2+ influx was measured. At 48 h after transfection, cells were loaded with Fura-2 AM and placed in Ca2+ and Mg2+-free HBSS and stimulated with thrombin (50 nM) to measure Ca2+ store depletion. After return of cytosolic Ca2+ concentration ([Ca2+]i) to baseline levels, 1.5 mM CaCl2 was applied to the extracellular medium to induce Ca2+ influx. Arrow indicates the time at which cells were stimulated with thrombin or Ca2+ was added. Experiments were repeated at least 4 times. A representative profile is shown. E: change in peak fluorescence ratio (334/380) for the Ca2+ influx in control and Myc-WT-TRPC1- or Myc-TRPC1-CΔ781-789-expressing cells was compared. *P < 0.05 significantly different from control; **P < 0.001 significantly different from Myc-WT-TRPC1.

