
Figure 2.
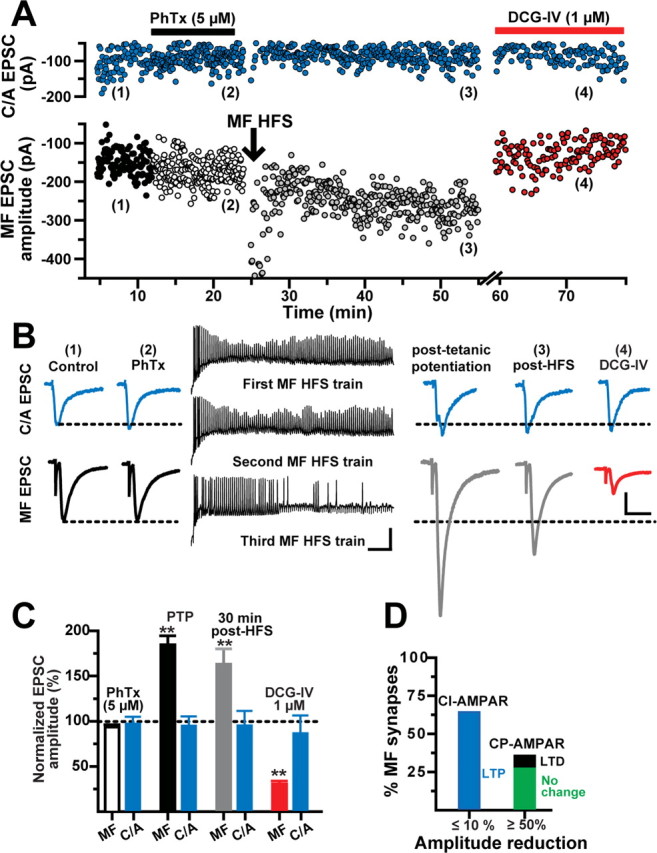
MF LTP is input specific and expressed at predominantly CI-AMPAR synapses. A, Representative experiment showing the time course of MF and C/A EPSC amplitudes before (1), during PhTx (2), after HFS of MFs (3), and during DCG-IV (4). Each circle represents a single EPSC recorded at 0.2 Hz. MF EPSCs were weakly (<10%) sensitive to PhTx (5 μm). LTP was induced at MFs but not C/A synapses. B, Left and right traces, Average MF and C/A EPSCs (10 consecutive sweeps) from the same experiment before and after HFS of MFs, respectively. Calibration: 50 pA, 10 ms. Middle traces, Membrane voltage responses show robust spiking during HFS of MFs. Calibration: 25 mV, 100 ms. C, Summary of the changes in MF and C/A EPSC amplitude (N = 11) during PTP, at 30 min after HFS, and during DCG-IV application. MF synapses were classified as containing CI-AMPARs (MF EPSC block by PhTx, ≤10%). D, Bar graph summarizing the proportion of MF synapses containing predominantly CI-AMPARs (N = 11) and CP-AMPARs (N = 7). All of the CI-AMPAR synapses underwent MF LTP. In contrast, in MF synapses predominantly containing CP-AMPAR the isolated CI-AMPAR-mediated response was unchanged after MF HFS (N = 5) or exhibited MF LTD (N = 2). **p < 0.001 or higher statistical significance.