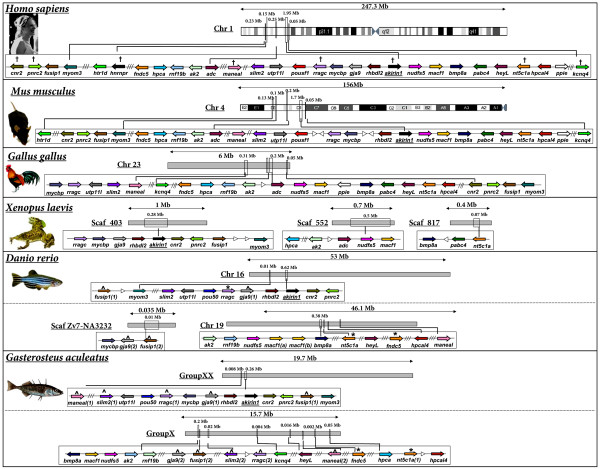
Figure 5.
The genomic neighbourhood surrounding akirin1 of mammals, birds, amphibians and teleosts. Human genes are named as by the Human Genome Naming Consortium (HGNC) and orthologues are shown as identical coloured arrows, indicating the direction of transcription. The distance between genes is not to scale although approximate locations of chromosomal regions are identified. White arrowheads show a gene with no orthologue in other species in the diagram. Double and triple diagonal lines indicate a genomic distance respectively spanning 2 and >3 genes. Crosses on the human tract identify genes that share a closely related gene family member on the chromosomal tract containing akirin2 (please see corresponding crosses on fig. 6). Robust phylogenetic reconstructions of evolutionary relationships within these gene families were also established (see fig. 7). ^ indicates teleost genes where both paralogues are conserved on duplicated chromosomal tracts within the scale of the diagram. * indicates teleost genes where a paralogue was identified located outside of the scale of the diagram. Clear double conserved synteny is present in teleost genomes relative to diploid vertebrate relatives.

