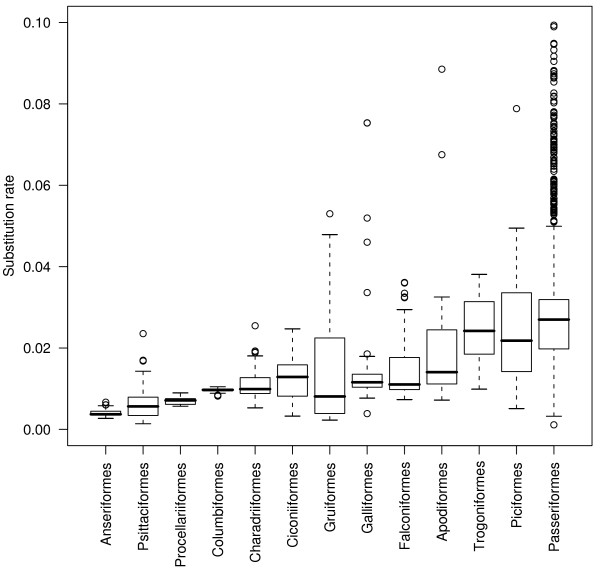
Figure 2.
Within-order distribution of the cytochrome b third codon position substitution rate. Substitution rates are in unit of substitution per third codon position per million year. Orders represented by more than 20 species are shown. Values above 0.1 substitution/site/Myrs years are not shown.

