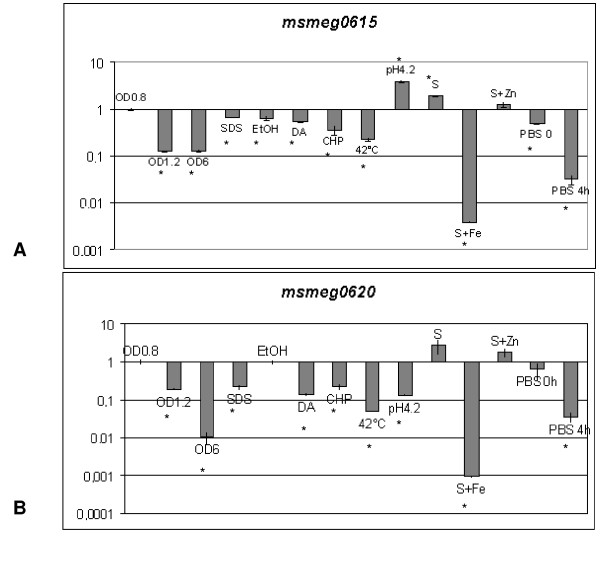
Figure 6.
Expression of msmeg0615 and msmeg0620 genes. Level of expression of msmeg0615 (A) and msmeg0620 (B) genes in differing growth and stress conditions relative to the expression of the same gene in 7H9 culture in mid-log phase (OD = 0.8) (taken as 1). The level of sigA transcript was used to normalize the amount of RNA. The value represents the average and the standard deviation of three independent reactions. * indicates that values are significantly different from the control value (p < 0.01).

