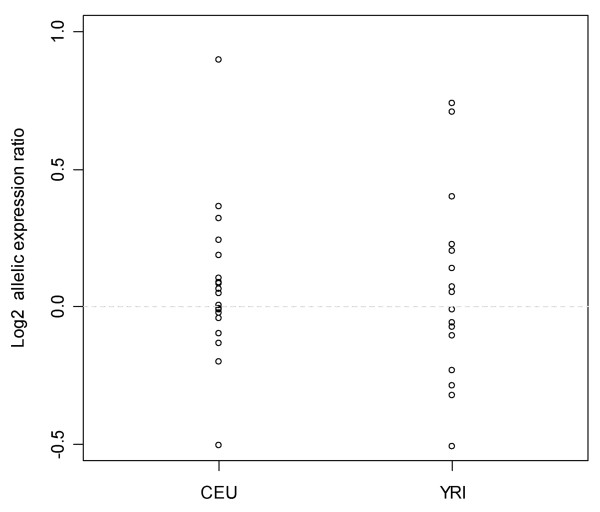
Figure 2.
Allele specific differences in TLR9 expression. Log2 allelic expression ratio between the A allele and the G allele in individuals heterozygous for the rs352140. Represented are the results for the 21 CEU and 19 YRI individuals. The mean allelic transcript ratio for each cDNA sample was normalised to the mean allelic transcript ratio of the respective gDNA control. The horizontal dashed lines indicate the A/G allele ratio of 1.

