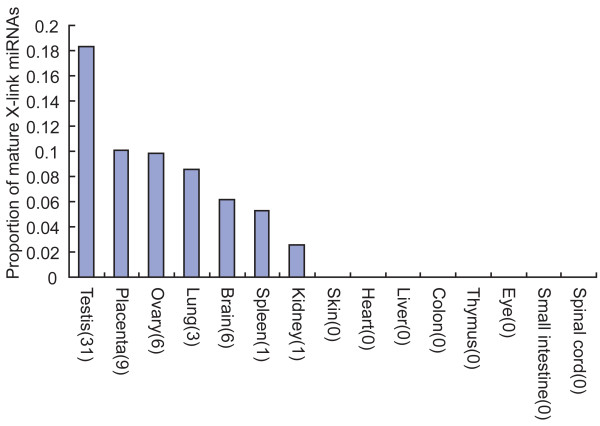
Figure 3.
Proportion of mature X-linked mouse miRNAs by tissues. miRNA data are from the mammalian microRNA expression atlas based on the small RNA library sequencing by Landgraf et al. [8]. The numbers of X-linked miRNAs cloned in corresponding tissues are shown in brackets.

