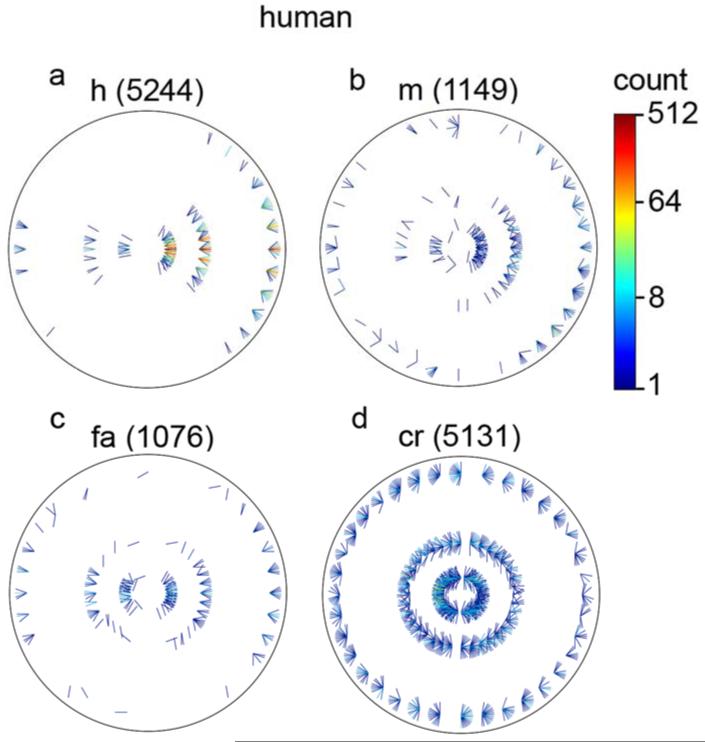
Figure 10.
Distribution of specific stimuli associated with (a) hits, (b) misses, (c) false alarms, and (d) correct rejections, for the human observers. The three rings correspond to the three occluder diameters, the location around a ring corresponds to the direction from the reference element, and the orientation of the line segment corresponds to the orientation difference between the elements. The right side of the plot represents the same contrast polarity and the left the opposite polarity. The numbers in parentheses are the total numbers of trials represented in each of the plots. (Note that the line segments in this plot are half the length of those in Figs. 5-7, but otherwise the plotting conventions are the same.)

