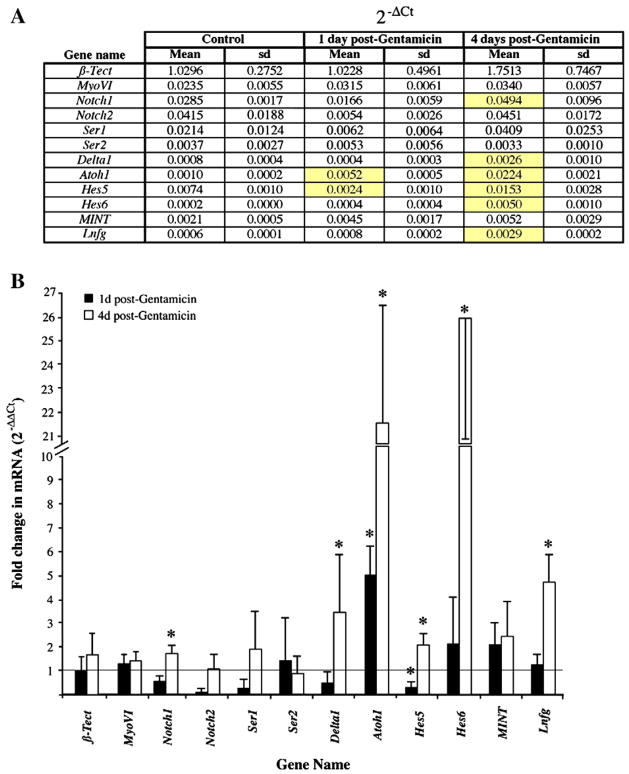
Figure 2. Differential expressison of Notch pathway genes in the quiescent and regenerating chicken BP.
Transcripts were quantified by qRTPCR, and data were analyzed using the 2−ΔΔCt method. A. The table shows mRNA expression for each target gene relative to β-Actin (2−ΔCt). Data were averaged across 3 samples for each condition; standard deviations (sd) are shown. Genes showing significant differences in each treatment group compared to controls (ANOVA; p ≤ 0.05) are highlighted in yellow. B. The graph shows average fold changes in mRNA between each treatment group and the control group (2−ΔΔCt), with error bars representing standard deviations. A value of 1 (line) represents no difference from control. Asterisks indicate genes with significant differences in 2−ΔCt between each treatment group compared to controls (ANOVA; p ≤ 0.05).

