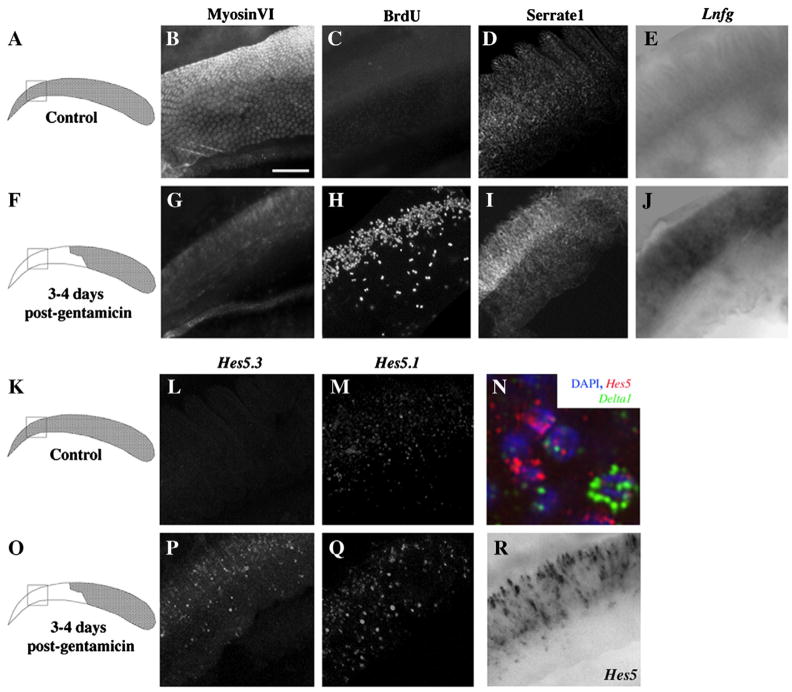
Figure 3. Localization of Notch-related gene expression in the quiescent and regenerating chicken BP.
All panels except the drawings in the left column show epifluorescent or brightfield images of the proximal whole-mounted BP. The box in each drawing shows the region from which images were taken for all panels in that row. Neural is toward the top, and proximal is toward the left. Panels B–E and L–M show control, undamaged BPs, and panels G–J, N, and P–R show BPs at 3–4 days post-Gentamicin. B,G. Immunolabeling for MyosinVI in control (B) and damaged (G) BPs. C,H. Fluorescent BrdU labeling (2-hour pulse/fix) in undamaged BP (C) and in BP after damage (H). D,I. Serrate1 immunofluorescence in control BP (D) and in BP after damage (I). In damaged BP, immunolabeling for Serrate1 increased after damage in the neural half of BP (I). In situ hybridization (ISH) shows low levels or no of expression of Lnfg (E) and Hes5.3 (L), and some Hes5.1 expression (M), in control BP. ISH shows upregulated expression of Lnfg (J), Hes5.3 (P), and Hes5.1 (Q) in neural BP after damage. Simultaneous labeling with probes for Hes5.1 and Hes5.3 shows Hes5 upregulation in neural BP (R). N. Triple labeling of Hes5’s (red), Delta1 (green), and DAPI (blue) shows little co-localization of Hes5 and Delta1. Scale bar = 60 μm for all panels, except in N, where scale bar = 6 μm.

