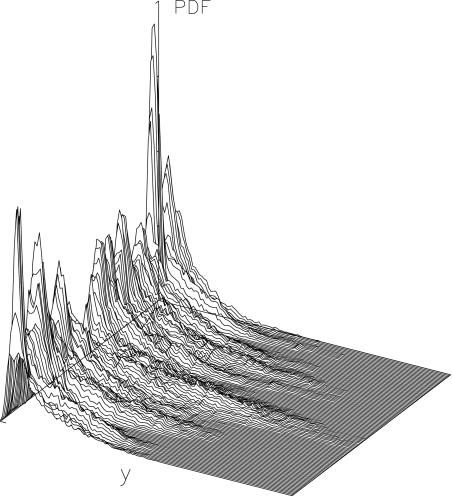
Fig. 5.
Local distribution  for the DNA model at temperature T = 300 K. Δn = 4, Δt = 2 × 10 − 10 s. The axis extending from left to right gives the values of the displacements y, and the axis going from front to back corresponds to n0. It extends along the 128 cells of the lattice used in the simulation, and the vertical axis corresponds to the distribution function

