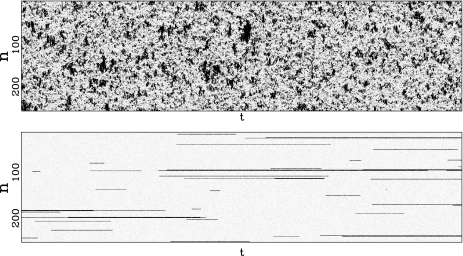
Fig. 8.
Comparison of the dynamics of the model with the Morse potential V(y) (top figure) and with the modified potential with a hump  (bottom figure) obtained from a numerical simulation of the models in contact with a thermal bath at 270 K. The stretching of the base pairs is shown by a gray scale going from white for a closed pair to black for a fully open pair (y ≥ 2.0 Å). The vertical axis extends along the DNA chain, which has 256 base pairs in these calculations, with periodic boundary conditions. The horizontal axis corresponds to time. The parameters used for this calculation are K = 0.01 eV Å − 2, ρ = 3.0, δ = 0.8 Å − 1, D = 0.05254 eV, α = 4.0 Å − 1 for the Morse potential (top figure) and α = β = 4.0 Å − 1, E = 4.0 Å − 1 and D = 0.0857 eV for the potential
  (bottom figure). The total time shown in these figures is 2 × 10 − 8 s, i.e., 1,000 times longer than for Fig. 4

