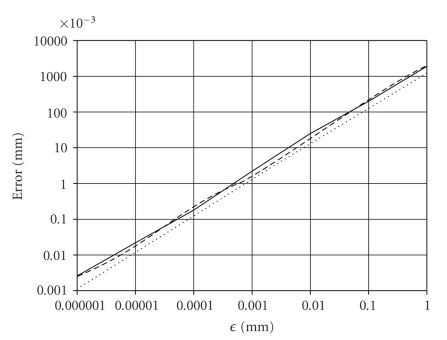
Figure 4.
The dependence of E iden (dotted), E sym (solid), and E tran (dashed) on ϵ for Ψ 1 is shown in the log-log axes for a representative image, image pair, and image triple, respectively. The three curves represent interpolations of the errors corresponding to ϵ of 0.000001 mm, 0.00001 mm, 0.0001 mm, 0.001 mm, 0.01 mm, 0.1 mm, and 1.0 mm. The squared correlation coefficient between E iden and ϵ is .9998, between E sym and ϵ is .99997, and between E tran and ϵ is .9998, indicating a strong dependence of the three errors on ϵ.

