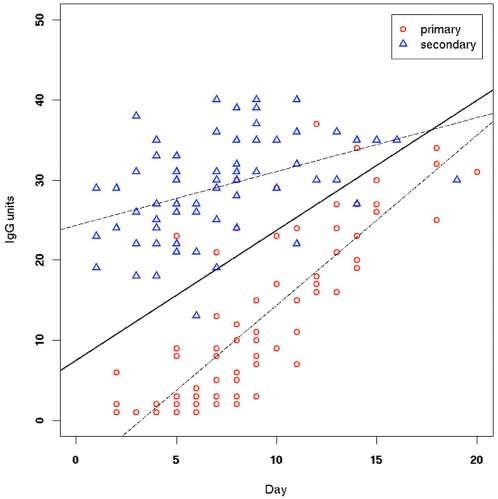
Figure 2. Training data, with primary and secondary infection classification according to the CPqAM criteria, with regression lines (dashed lines) and LDA classifier (solid line) superimposed.
The regression line for the primary infection group corresponds to the equation IgG = −6.865+2.126×day, whereas the one for the secondary infection corresponds to IgG = 24.327+0.674×day. The slopes (dependence on day of infection) and intercepts were highly significant, for both primary and secondary infection groups (p<0.0005 in all cases). The difference between the intercepts is also highly significant (p<10-15), indicating a difference in initial immune response that reflects immunological memory in the case of the dengue-specific IgG. In addition, there is significant interaction between infection type and days of fever (p<10-7), that is, the lines are not parallel, and the trends within each group are significantly different, suggesting that it may be possible to define acute dengue infections on the basis of the rise in IgG level alone. The two regression lines converge near the 20-day limit, indicating that the groups cannot be reliably discriminated beyond this number of days. The equation for the LDA line is y = 7.494+1.623×x. The LDA classifier is depicted as a solid line in Figure 2.

