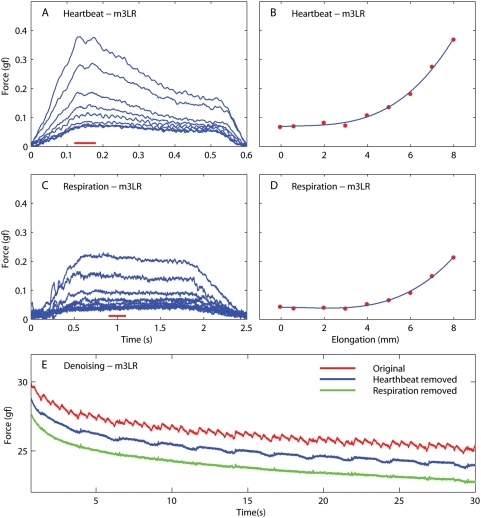
Figure 2. Sources of noise in our force measurements.
Data are from the lateral rectus (LR) of the second monkey (m3). A: Heartbeat noise templates at different muscle lengths. B: Magnitude of the heartbeat noise (average over the time interval indicated by the red bar in A) as a function of muscle length. A least-squares cubic fit to the data is shown in blue. C: Respiration noise templates at different muscle lengths. D: Magnitude of the respiration noise (average in the time interval indicated by the red bar in C) as a function of muscle length. A least-squares cubic fit to the data is shown in blue. E: Red: Part of the relaxation response measured in the same muscle after a quick step. Blue: Same as red trace, but after template-based removal of the heartbeat noise (shifted down by 1 gf for clarity). Green: same as blue trace, but after template-based removal of the respiration noise (shifted down by 2 gf for clarity). The green trace is the denoised data used in all subsequent analyses.

