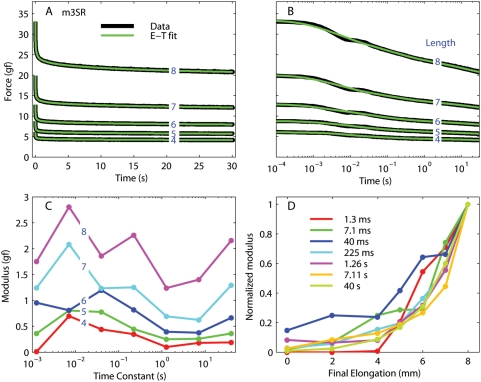
Figure 5. Relaxation responses from the superior rectus in m3.
A: Data (black) and fits (green) for five different steps (blue numbers are the final length in mm). The steps at the smallest final length are not plotted for clarity, but the fits were just as good. B: Same as A, but using a logarithmically spaced abscissa to improve visualization of the force at short times. C: Moduli associated with each time constant in the fit; one line for each final length. D: Normalized moduli as a function of muscle length after the step; one line for each time constant. Note that in this panel the shortest lengths are also represented.

