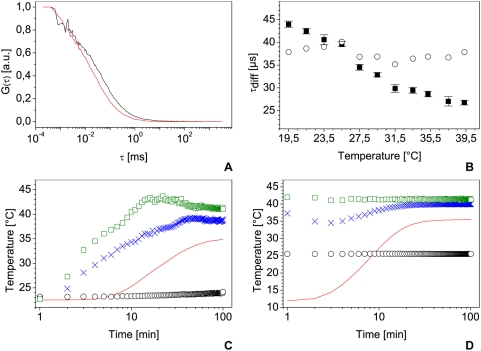
Figure 2. Highlight on temperature control.
Normalized autocorrelation curves measured on Alexa 488 10 nM aqueous solution at 20°C (black curve) and 37°C (red curve) (A) and associated diffusion times for temperatures ranging from 19.5°C to 39.3°C with their standard deviation (B, squares) and diffusion times corrected for 25°C using temperature and water viscosity (B, circles). All measurements were done with the same laser power and a water immersion objective with a NA of 1.2. C and D: temperature measurements of room temperature (black circles), air temperature one centimeter behind the sample (blue crosses), air temperature at the incubator output (green squares) and temperature in the sample (red line). Temperature was measured from the incubator startup (C) or from the introduction of a 4°C sample introduction in a stabilized incubator (D).

