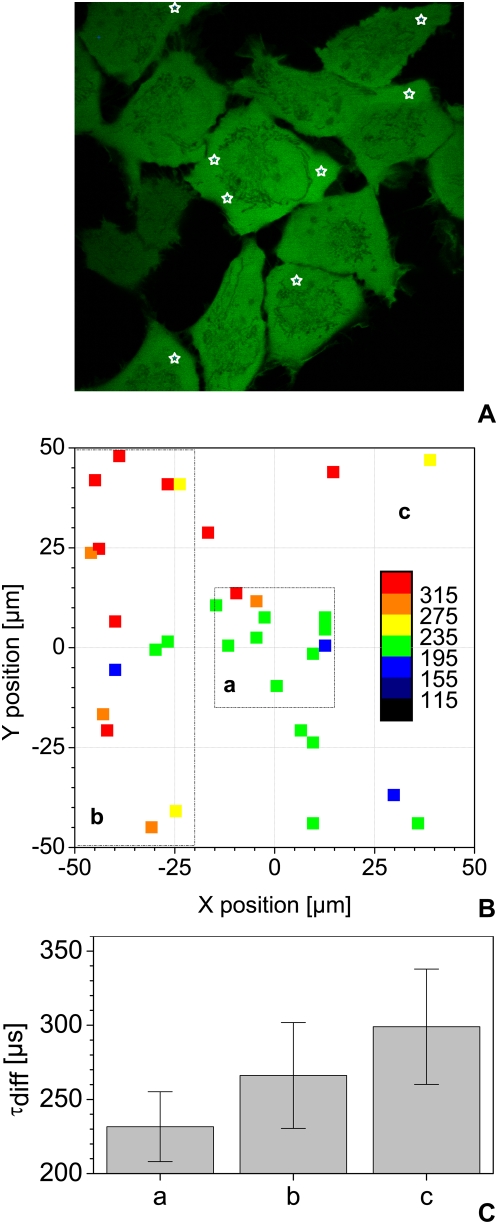
Figure 5. Effect of XY focus position on live cell measurements.
Diffusion time of free eGFP was measured in the cytoplasm of living cells at various scanner X and Y positions as depicted by the white stars in (A). Several such acquisitions over a 100×100 µm area were performed and analyzed. The resulting diffusion times of 33 points in about 20 cells – after sorting out cells that had moved during the measurement – were color-coded as shown in (B) and subdivided in 3 distinct regions. Panel (C) presents the mean diffusion time and standard deviation obtained in the 3 regions shown in (B): a) for a central region of 30×30 µm b) for the whole scanning area of 100×100 µm and c) for a band of 30×100 µm on the left of the scanning area. All measurements were carried out at 37°C, with the same laser power, using a water immersion objective with a NA of 1.2.

