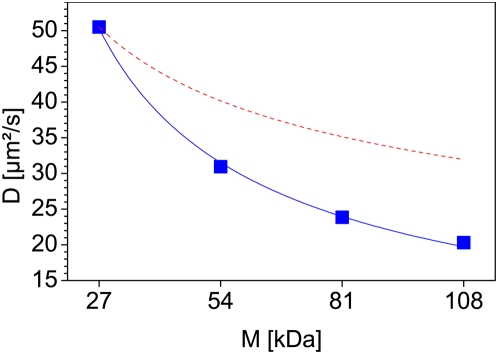
Figure 11. Decrease of the diffusion coefficient in the cell nuclei.
The figure shows the diffusion coefficients of the eGFP oligomers (blue squares) plotted against their molecular weight. The diffusion coefficient shows a stronger decrease in cell nuclei (blue curve) than expected for free diffusion (red dashed curve). The power-law has here an exponent of −0.67 for the diffusion of the eGFP oligomers while free diffusion would show −0.33.

