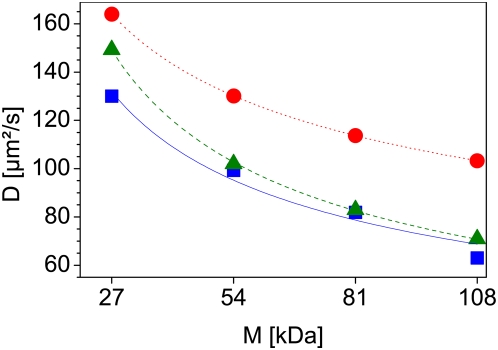
Figure 12. Free diffusion of the eGFP-oligomers in solution.
The squares and the solid curve (blue) show the measured diffusion coefficient for the different eGFP-oligomers, while the circles and the dotted curve (red) represent the theoretical values for a globular shaped molecule and the triangles and dashed curve (green) for a rod-shaped molecule, plotted against the molecular weight of the different oligomers. All measurements were carried out at 37°C using a water immersion objective with a NA of 1.2.

