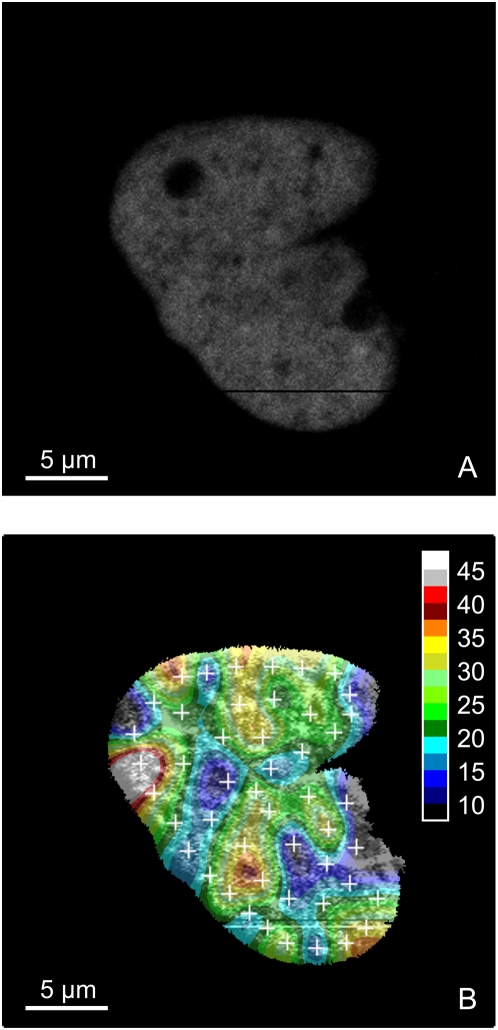
Figure 14. Diffusion map in the nucleus of a HeLa cell.
Only the nucleus of a HeLa cell is represented on this figure and the color map shows the diffusion coefficient of eGFP in the nucleus. (A) Fluorescence intensity of H2A-mRFP1. (B) Diffusion map of eGFP (colors) underlaid by H2A-mRFP1 fluorescence intensity. The white crosses show the 48 measurement points, corresponding to a total measurement time of 288 seconds. Measurements were carried out at 37°C in 5% CO2 atmosphere, using a water immersion objective with a NA of 1.2.

