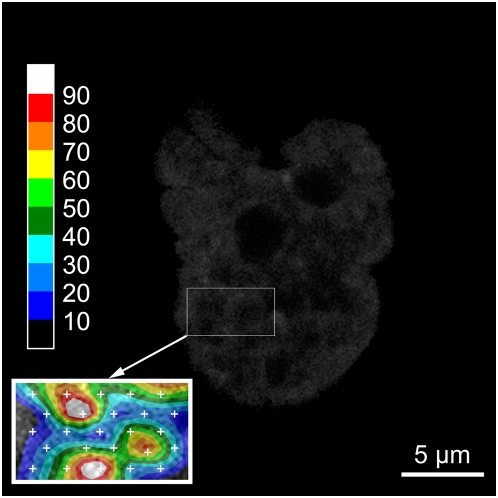
Figure 15. Interpolated detailed diffusion map of a part of a nucleus of a HeLa cell.
The figure shows the H2A-mRFP1 tagged nucleus of a HeLa cell. Only the region in the cartridge is mapped and enlarged 2 times. Data were sampled on 25 points (white crosses in the cartridge), distributed on 5 lines of 5 points, with an inter-point distance of about 1 µm and 0.6 µm for the inter-line distance, covering an area of about 11 µm2. Each color step corresponds to a 10.0 µm2 s−1 range of the diffusion coefficient of eGFP. The white crosses mark the measurement points. Measurements were carried out at 37°C in 5% CO2 atmosphere, using a water immersion objective with a NA of 1.2.

