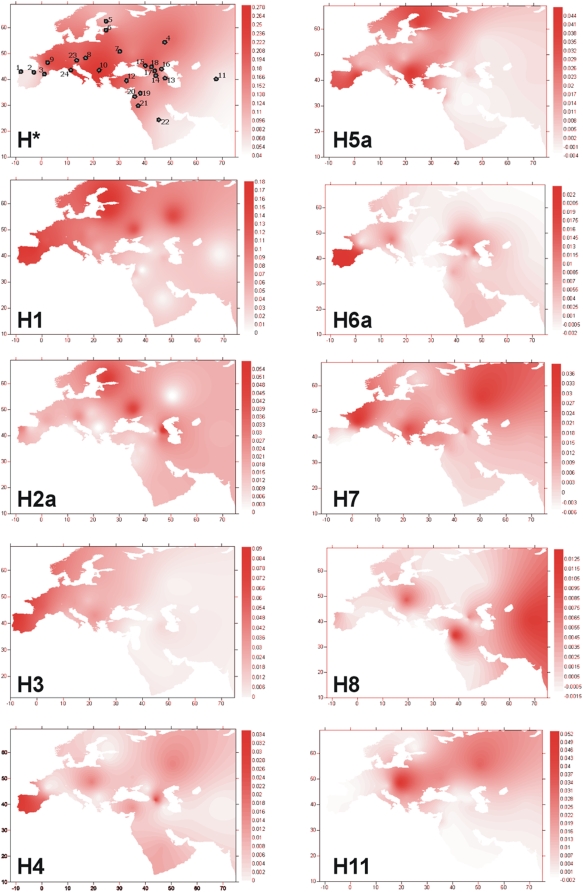
Figure 3. Geographic maps of haplogroup frequencies for haplogroups H*, H1, H2a, H3, H4, H5a, H6a, H7, H8, H11.
Dots in the map of H* indicate the location of the populations used. Codes for populations are: [1] Galicia, [2] Cantabria, [3] Catalonia (present study); [4] Volga-Ural, [5] Finland, [6] Estonia, [7] Eastern Slavs, [8] Slovakia, [9] France, [10] Balkans, [11] Central Asia [3]; [12] Turkey, [13] Armenia, [14] Georgia, [15] Northwest Caucasus, [16] Daghestan, [17] Ossetia, [18] Karatchians-Balkarians, [19] Syria, [20] Lebanon, [21] Jordan, [22] Arabian Peninsula [4]; [23] Austria [6]; [24] Tuscani [14].

