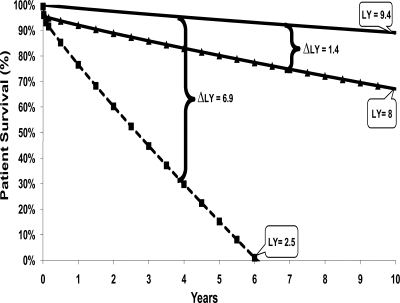
Figure 1.
Survival plot among patients with long-term sustained function of both allografts compared with expected survival with organ-specific graft failure.* SPK recipient with no graft failure (n = 3,304) (solid line); SPK recipient with pancreas allograft failure and sustained kidney allograft function (n = 233) (▴); and SPK recipient with kidney allograft failure and sustained pancreas allograft function (n = 112) (■). Δ, the difference in patient survival (in life-years) caused by loss of a graft; LY, life-year. *Depicted scenarios assume that allograft failures occur at day 365 after SPK transplant (at time zero on the survival plot).

