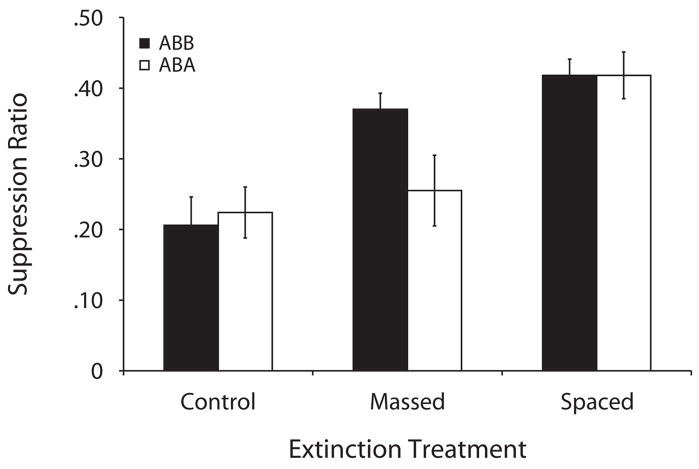
Figure 2.
Mean suppression ratios to the target CS in the testing phase of Experiment 2. The control groups did not receive any extinction trials, and the massed and spaced groups received 20 extinction trials. Subjects were tested in the extinction context (ABB design, black bars) or in the acquisition context (ABA design, white bars). Lower values denote more suppression, and larger values denote less suppression (i.e., more extinction).

